Project 2 overview: Linear regression - math vs. machine learning
- Implemented linear regression for revenue prognostic through machine learning and math.
- Controlled accuracy of the linear regression through MSE, MAE, coefficient of determination and RMSE.
- Compared linear regression trough machine learning with linear regression through math.
Code and resources used
- Python 3.9.15.
- Packages: pandas, numpy, math, seaborn, matplotlib.pyplot, statistics, sklearn.model_selection, sklearn.linear_model.
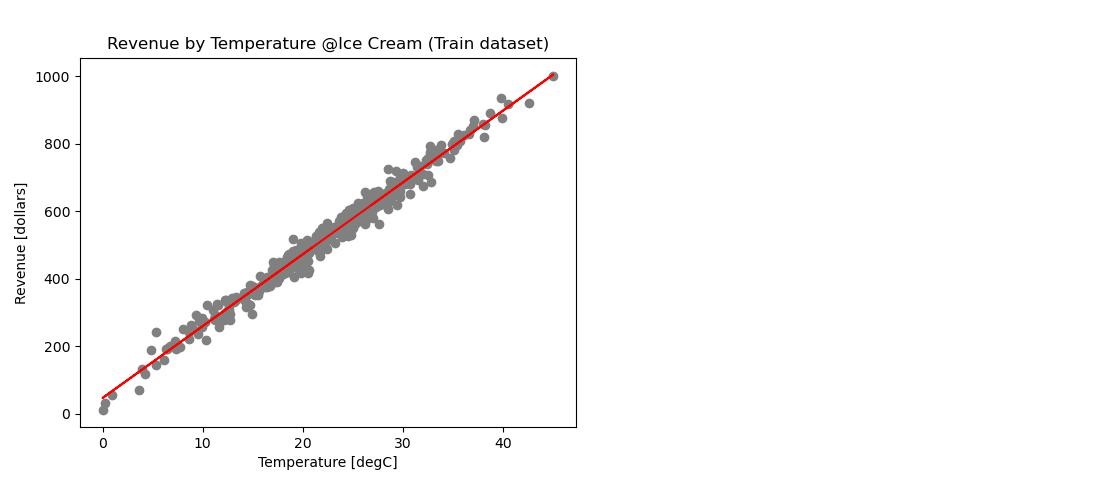
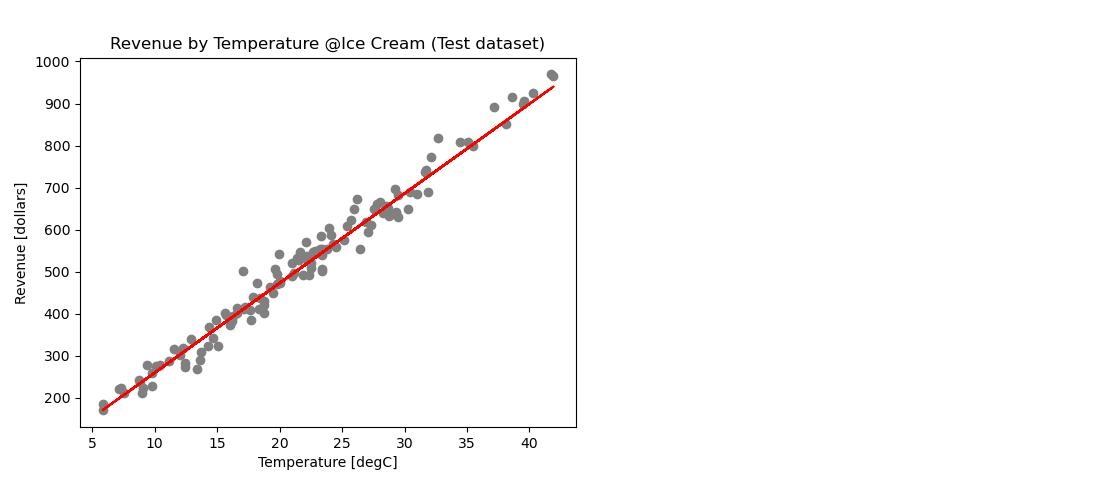
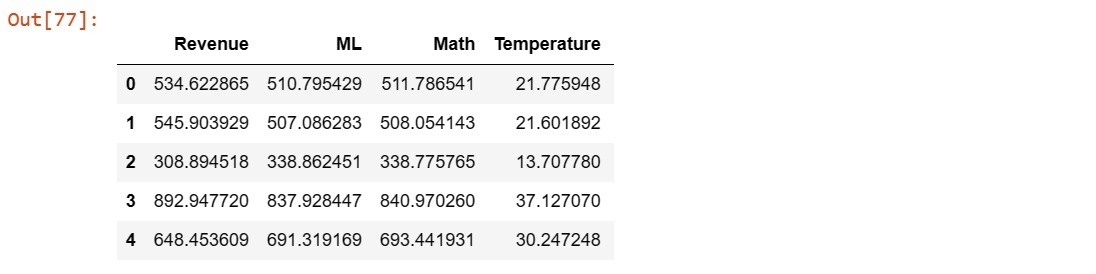
- dataset: 500 rows of daily revenue by temperature of an ice cream shop in IceCreamData.csv
Data cleaning
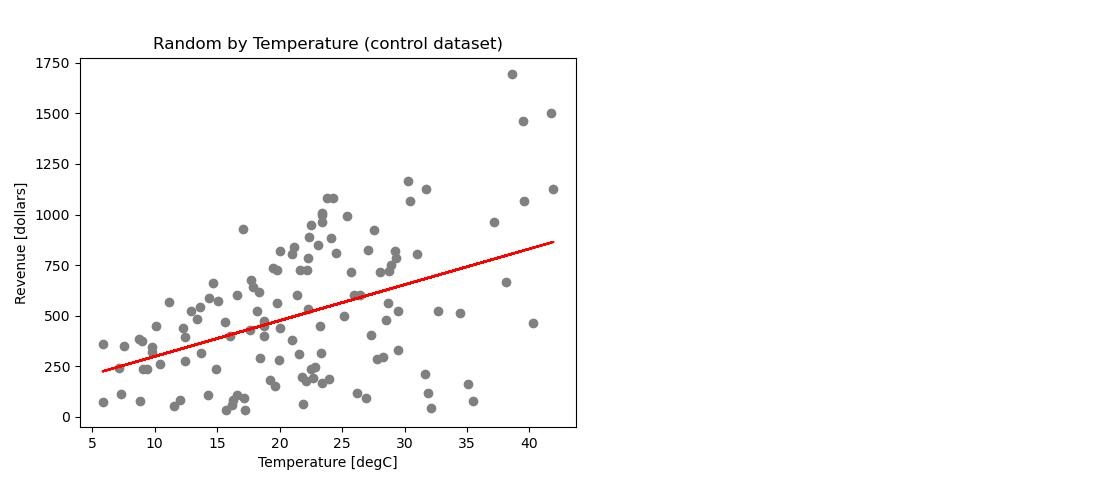
- Created a column with random values for comparison of obtained measures. Thus data can change by running the code, also because of random data selection for ML.
- Just an overview was required, because of non null-values in the dataset.
EDA
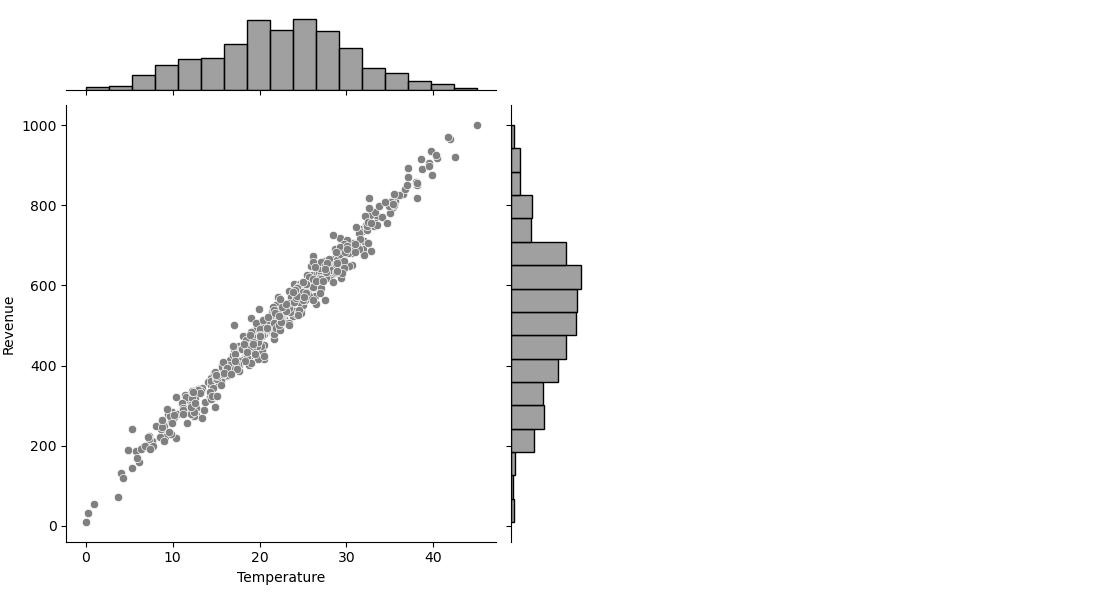
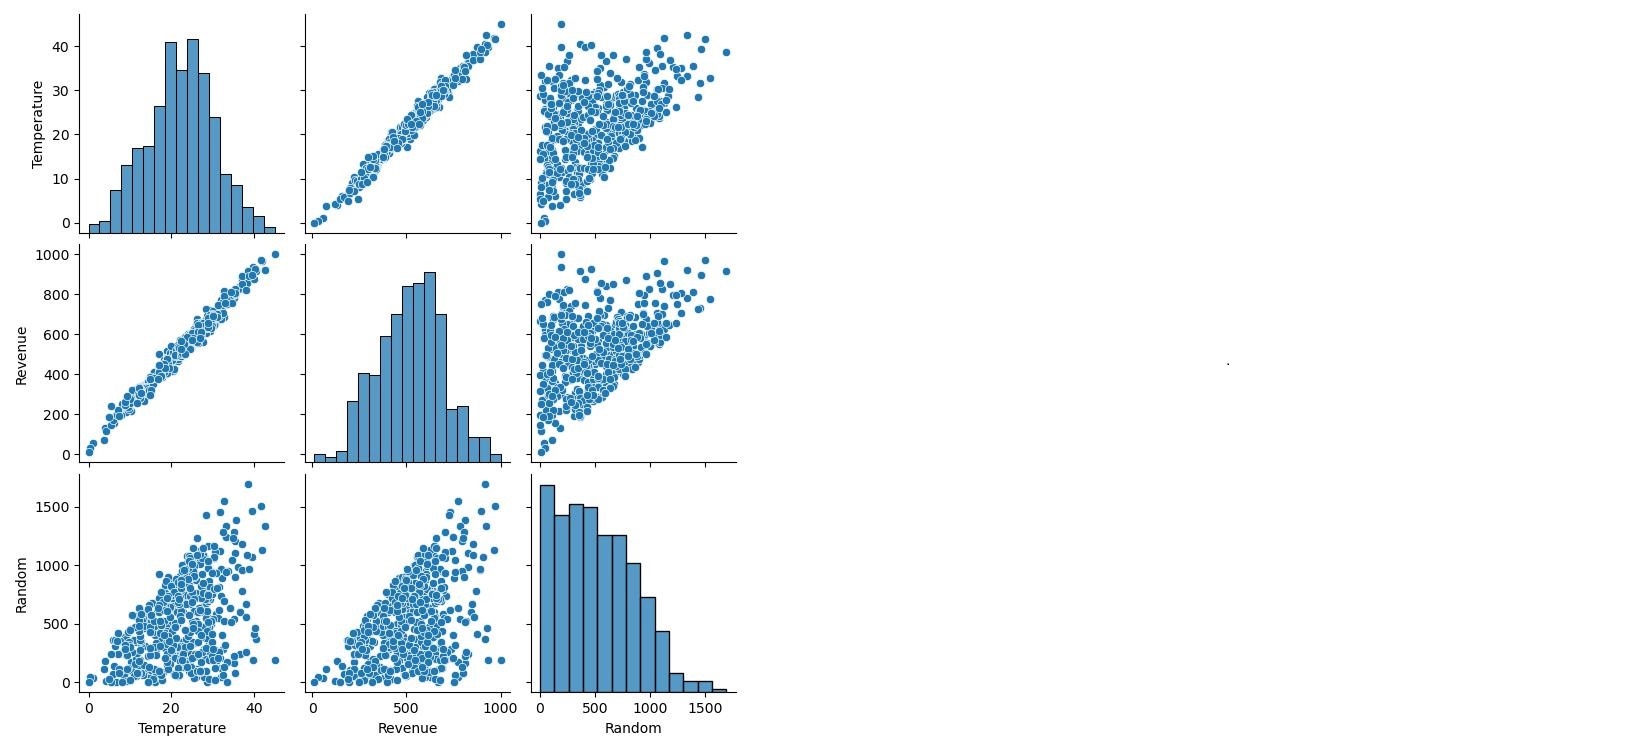
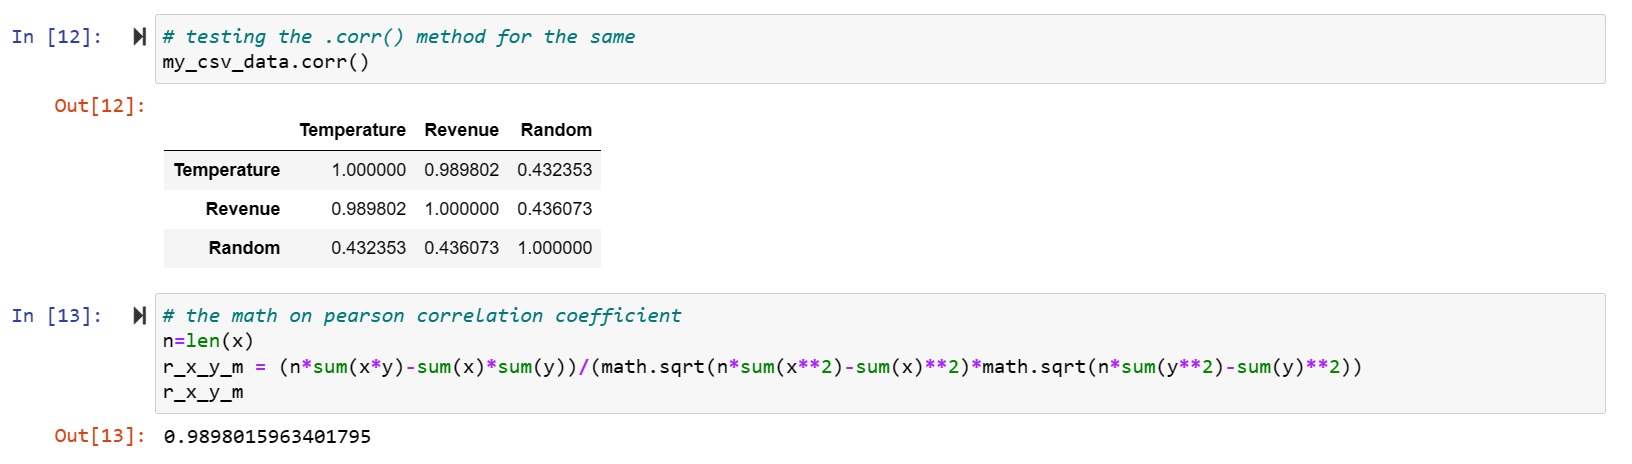
- I looked at the distributions of the data and the correlations between the columns with the pearson correlation coefficient.
Model Building
Math-Model
- Reached to the linear regression line through math with $y_{line}= mx+b$, with $m= \frac{n \cdot \sum xy - \sum x \cdot \sum y}{n \cdot \sum x^2 - (\sum x)^2}$ and $b = \frac{\sum y - m \cdot \sum x }{n}$.
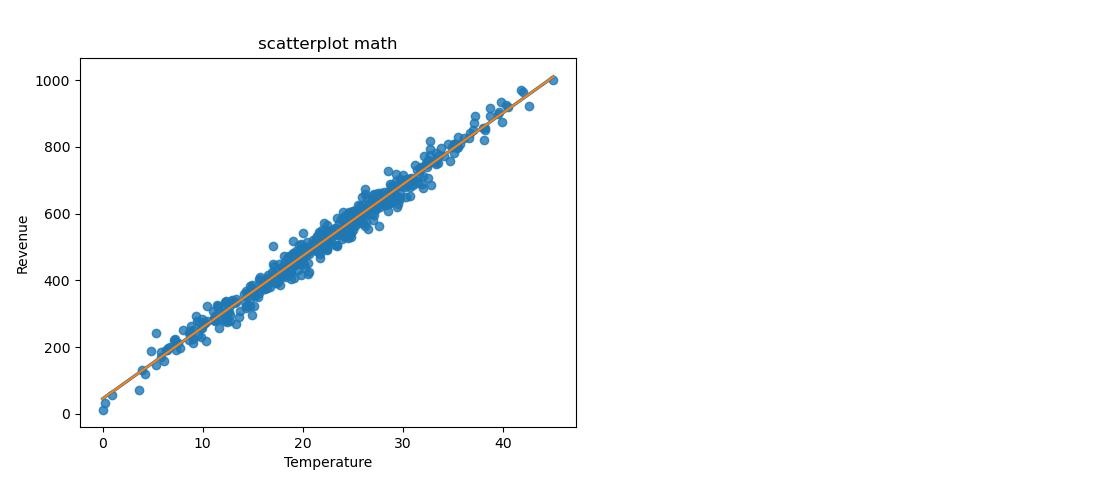
- Detected 68% of main data around the regression line without outliers with the corridor $y\in [y_{line} - RSME, y_{line} + RSME]$, because of similarity of RSME to standard deviation. (95% with two times and 99,7% three times RSME, add rounding error)

Machine Learning-Model
- Splitted randomly the data in conventional 75% for training and 25% for testing the model.
- Trained the model through machine learning with “from sklearn.linear_model import LinearRegression” on 75% of randomly selected data.
- Tested the trained machine learning linear regression model, applying regressor.predict() on the remaining 25% of randomly selected data.
Visual comparison
- Plotted for comparison both regression lines on the same scatter plot: red is machine learning, blue is math. Because of no evident difference, got on to numerical performance metrics.
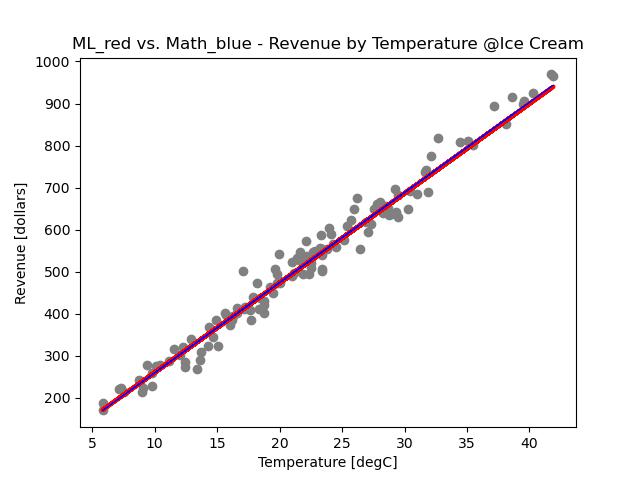
- ML: $\hspace{1em}MSE = 805.46,\hspace{1em} MAE = 22.24, \hspace{1em} R^2 =0.9763, \hspace{1em} RMSE = 28.38$
- Math: $MSE = 789.48, \hspace{1em} MAE = 22.03, \hspace{1em} R^2 = 0.9768, \hspace{1em} RMSE = 28.10$
- Linear regression through math seems to be more accurate, because ML is using 25% less data, thus only 75% of the data for training.
- MSE expresses clearly a difference between ML and Math, because of the square.
- Controlled numerically with examples.
- Controlled outcomes with random data.